Comparison with 400 Clients – UD 5.0 Benchmarks – Part 4
This is a continuation of our series focusing on the performance difference of the Universal Driver 5 and 4.7. In what is likely to be the last article in the series, we resume testing the number of simultaneous clients and the rate in which they are able to read records from the Linear Hash service. Please note, however, that these tests were performed with UD 5.0.0.2. Since then, Revelation Software has released two more patches. The latest patch addresses some rather significant performance issues which were identified in the wild. Given that our tests are synthetic, we do not expect the following results to vary much. Therefore we opted not to retest our results in the latest release.
For an explanation of our test environment configuration, please see our previous article.
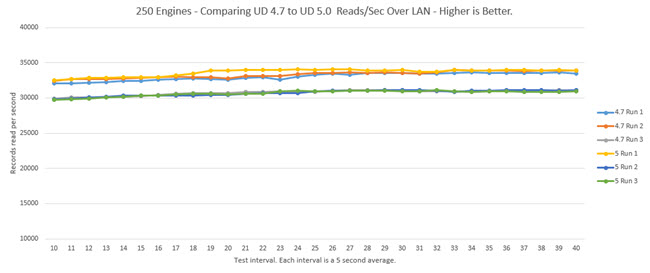
5×50 LAN Benchmark – 250 Clients
The graph shows the cumulative records read/sec by each of the clients on each of the servers was fairly consistent between each Universal Driver. The 4.7 average for the three test runs was 33,477 recs/sec and the 5.0 was 30,940.
The results are almost identical to the 50 client test from the previous blog article which is impressive even though 5 times the number of clients are added.
Let’s see what happens when the number of clients is once again increased.
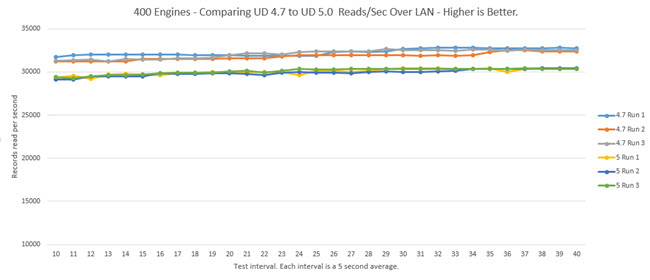
5×80 LAN Benchmark – 400 Clients
In our last and final of this series we see the same pattern carry through from the 50 and 250 client tests. The 4.7 Universal Driver performs a few hundred recs/sec better on average than the UD 5.0. Remarkably both services run solidly without any decrease in throughput despite the increase in clients.
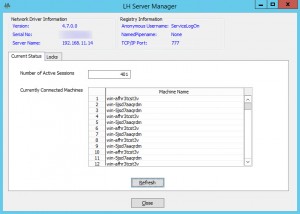
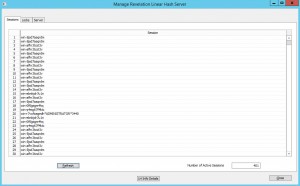
To wrap up these last tests, we present screen shots of the UD manager showing the number of connected workstations.
Results Table
| Clients | Test Run | Recs Read | Time | Recs/Sec | 3 Run Avg |
|---|---|---|---|---|---|
| 250 | UD 4.7 Run 1 | 9,760,015 | 293 | 33,311 | 33,477 |
| 250 | UD 4.7 Run 2 | 9,876,802 | 294 | 33,595 | 33,477 |
| 250 | UD 4.7 Run 3 | 9,856,940 | 294 | 33,527 | 33,477 |
| 250 | UD 5.0 Run 1 | 9,081,695 | 293 | 30,996 | 30,940 |
| 250 | UD 5.0 Run 2 | 9,077,936 | 294 | 30,877 | 30,940 |
| 250 | UD 5.0 Run 3 | 9,067,876 | 293 | 30,948 | 30,940 |
| 400 | UD 4.7 Run 1 | 9,578,567 | 295 | 32,470 | 32,329 |
| 400 | UD 4.7 Run 2 | 9,478,445 | 295 | 32,130 | 32,329 |
| 400 | UD 4.7 Run 3 | 9,522,045 | 294 | 32,388 | 32,329 |
| 400 | UD 5 Run 1 | 8,878,239 | 294 | 30,198 | 30,205 |
| 400 | UD 5 Run 2 | 8,859,730 | 294 | 30,135 | 30,205 |
| 400 | UD 5 Run 3 | 8,902,956 | 294 | 30,282 | 30,205 |
Conclusion
In each test since the last article’s 50 client test we see the upper throughput limit of the read tests. Adding more clients did not increase the read throughput, yet we do observe that 250 and 400 clients run at a consistent rate despite the added number of clients.
We also see a delineation between the 4.7 and 5.0 test results with the 4.7 consistently running marginally faster in our synthetic tests. Perhaps the new features in the UD 5 add a level of overhead to each record read that becomes apparent during high loads. Nevertheless, it seems clear that the combination of great new features and negligible performance differences makes the UD 5 a solid performer and well worth consideration.
We hope you enjoyed this blog series, it was a labor of love and required a lot of retooling to gather and present over 1.2 million data points used to generate this blog series in a meaningful way. We wish to thank Bob Carten for giving this article series a shout out in his Performance Tuning presentation at the 2016 Revelation User’s Conference. There are many other variations of tests yet to perform so if you enjoyed this series please leave your comments and questions as it will help influence future benchmark articles.

Hi Don, What do you mean by your tests being ‘synthetic’? I would loved to have seen the results under the UD 5.0.0.4 because one of my customers is suggesting that there is an improvement in read performance. I am not shouting about these too much (other a blog posting) because,based on all systems being different, I am interested to see hat other people are finding on their systems.
Thanks for this blog series though. It has been very interesting.
Martyn.
Hi Martyn. Jared wrote the article and performed the benchmarks, but since you directed the question to me I’ll do my best to respond. “Synthetic” simply means it’s all done in a test lab under a controlled environment. Hence, this is not a “real world” test, which is what the Revelation team was able to work with when they visited your UK customer. Jared reviewed the circumstances that suggested improved performance but did think it would apply to our testing environment. We did consider re-running our tests using UD 5.0.0.4, but this takes quite a bit of work and we did not want the original effort to be wasted. However, your response helps to encourage us to plan on more tests using the latest release so you may very well see some comparison reports in the future.
Synthetic also means that the workload doesn’t mimic real world patterns. Workloads are usually comprised of reads and writes to the database. Even then, the amount of reads and writes aren’t usually equal so it’s difficult to design a test that captures each application’s expected results. Clients usually read more records than are updated, but this depends on the work load as some can be more write intensive. In this series it’s not realistic to think that 400 clients performing only reads is an expected workload but it does reveal throughput doesn’t increase or decrease after 50 simultaneous clients.
Thanks Guys. I guess that this was the case but I just wanted to check. It is those real-world tests that I find specifically interesting but the canned tests,like yours, are just as useful.
Thanks for taking the time out to complete these.
Great stuff!
Wondering if you’ve had any thoughts about doing any comparisons between OI using SSD and non SSD (Raid)?
If there was no dramatic difference; I’d be especially curious to see the same SSD test with large OI tables properly sized (standard deviation close to 1) and not properly sized (huge overflow and empty primary frames) tables (same table, same data). Oh, and run using LH 5.0.0.4 with auto sizing turned off.
Thank you Jared and SRP for the time and effort these benchmarks take to produce and report on.
Great ideas. Now that the lab is setup to benchmark a larger workload this type of benchmark might prove doable. Anecdotal experience and previous attempts with small tests revealed that there was little difference between SSD, conventional disks with RAID cache, and improperly sized files because the frequently accessed data was cached which made everything run fast until the workload exceeded what could be kept in cache. I’ll try to put together an article covering this.
Good work guys.
There were some big changes to 5.0.0.3/4 around I/O flags – so testing that wouldn’t be a waste of time.
Re: SSD – LH is very latency sensitive. UD to Storage latency impacts performance significantly so Direct Attached Storage (DAS) is much faster than Network attached Storage (NAS) regardless of the storages IOP’s ability. DAS SSD storage is much faster than DAS spindle.
You should also seriously consider testing / changing frame sizes to match the Storage. We have experienced significant performance benefits in using 4k frame sizes on DAS SSD.
The I/O flag changes caught my attention too and I am actively working on a blog article to benchmark the differences.
Regarding the frame size, there is definitely enough for a good benchmark article but the problem is smaller tests usually don’t reveal much of a difference because of the Windows System Filecache speeding up all read access. It isn’t until the tests get large enough and exceeds what can be kept in cache (or disk storage slow enough) that the real performance impact of the frame size comes into play. Thanks for the ideas.
Mark/Jared,
This is where I was headed and curious too. If a file is sized to perfection, you have the same amount of records in every primary linked frame regardless of frame size (separation we called it in Pick – with 512k being the base size. 1024 would be a separation 2, 2048 – 4 etc.) and no overflow.
This would be a standard deviation of 1. Of course this is almost impossible in real world data but getting close to a 1 was something we used to strive for when sizing/resizing Pick files. (Worth noting that ItemId’s need to be numeric only to hash ‘across’ the primary linked frames evenly).
This was the theory, if there was no or limited overflow frames, and limited disk spin to read/access contiguous frames, then i/o to records should be really fast?
Now that we have better HDD, greater memory and cache sizes; going a step further, it would be really interesting to see benchmarks not only on SSD vs. HDD but also IMDB and MMDB. With and without properly sized files. And also SSD Cache with HDD vs. just HDD. More food for thought.
Great conversation.
Everything you’re talking about there is software optimisation of the reads/writes. This is important because disk I/O is relatively the slowest thing do, so minimising the hops to disk is our goal. Due to Hash clumping we can never get the perfect file though.
There is another side to that coin, the infrastructure and the units of currency it works in, 4k blocks. So your request for an 8k frame = 2x hops for the disks. We have seen impressive performance increase just by going to 4k frames, ignoring the record sizes. I need to do more testing around the bigger frame sizes for tables who’s average record size is greater than 4k. My initial test in that gave horrible results, but that was a long time ago and our infrastructure has changed a lot so this is something I want to revisit.
I remember in the Novel days and Arev a select on the network would be faster than on a stand alone work station (my development system). Now that I have a laptop with 500Gb SSD a select (using OI 9.4) is at least twice as fast on my laptop than on the client system. I am no expert in different configurations but it seems laptop performances have improved much more than network performances.
Just an observation.
Chris the important thing for OI performance is latency to disk. So Client to Network, no UD = slow because the hop over the network will really slow things down. Using UD the File I/O happens on the server so performance is much better good (and safer).
Now with modern servers we have more challenges especially with big infrastructure teams who want to virtualise everything and use shared network storage. Putting the disks remote to the server puts you back in that high latency to disk position (even with UD) so performance is impacted.
On your local box your Oengine is right next the data so yes, its going to be quick – but then only you can use it.