Configuring the OpenInsight Debugger
 As an Authorized Training Center for Revelation Software products, we see it as our duty to equip our students to be as productive as possible. This goes beyond tookit and syntax instruction. The developer should be aware of the various ways each tool can be configured. For instance, we often suggest that the “Minimize Workspace” checkbox be set in the Form Designer Preferences dialog so that developers can see what their form will look like on the Windows desktop.
Recently, one of my former students remembered that I had shared some advice regarding the OpenInsight Debugger, but he could not remember the specifics. He asked if I would remind him of what I had instructed. After applying the information I gave him he became a much happier developer. While this information has been familiar to the Revelation community for many years, I realized that many newer developers might not be aware of the ability to configure this underrated and commonly used OpenInsight utility.
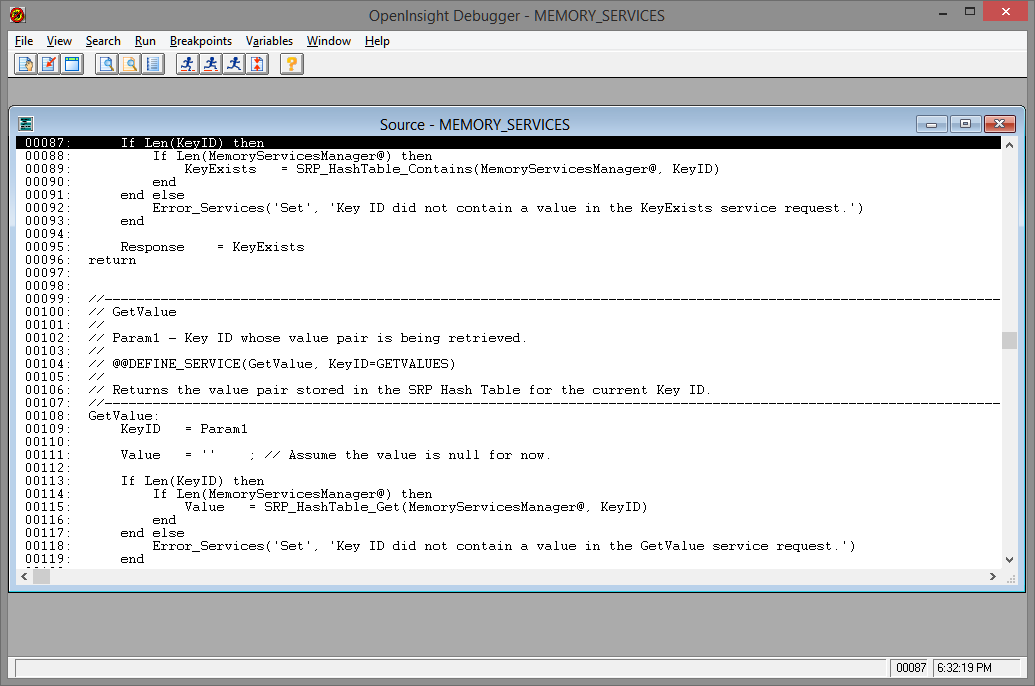
When the OpenInsight Debugger is invoked in a clean installation environment, it will occupy the entire desktop, although not in a maximized state. Thus, portions of the Debugger will appear behind the taskbar. The Source MDI child window will also appear, highlighting the line of code that triggered the Debugger:
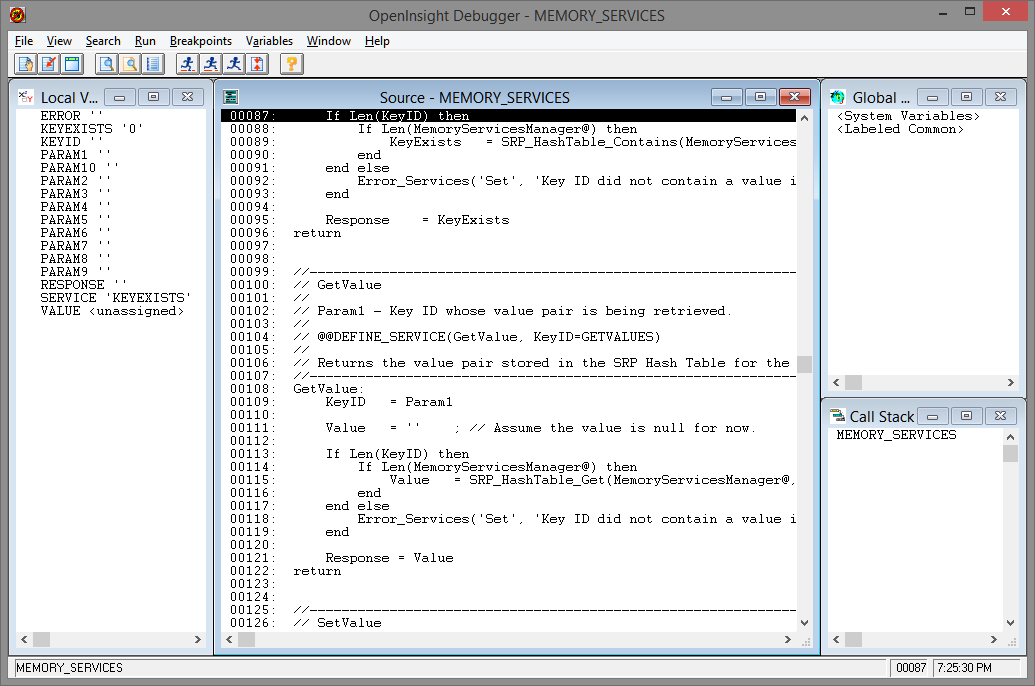
Some perceptive developers have realized that if the Debugger window is moved or re-sized, the new display parameters are preserved for the next session. The Source, Local Variables, Global Variables, and Call Stack MDI child windows also have their positions preserved. Furthermore, except for the Source window (which will always appear when the Debugger is invoked), the other windows will remember if they should be visible. Armed with this information, the Debugger can be modified to to give the developer a better usability experience. Thus, rather than always moving one MDI child out of the way, these windows can be positioned according to the preference of the developer and they will appear this way for future sessions. Here is an example of a layout that I like to use:
There are two ways to configure this display. The first is to simply use your mouse to move the various window borders to the desired location. If a desired window is not visible then click on the View menu and toggle the relevant menu item. After you have the windows positioned properly, allow the Debugger to close gracefully (i.e., let the program continue (F5) or Abort the program.) The next time the Debugger is launched you should see the layout as you left it. This will remain even if you restart OpenInsight.
Clearly OpenInsight must have a way of storing the layout preferences for the Debugger. This brings us to the second way to configure the display: manually modifying the layout preferences. As it turns out, this information is stored in the OINSIGHT.INI file (see our previous blog article for information on where this file is located). As many developers already know, this file contains several sections, many of which pertain to a different OpenInsight tool. Once the Debugger has been used, a section labelled [RevDebugger] will appear. Under this label is a configuration line for the main Debugger window and additional lines for each MDI child window will be visible. Here is an example of what this can look like:
[RevDebugger]
WinMain = 2, 3, -32000, -32000, -1, -1, 0, 0, 1616, 876
WinLVar = 0, 1, -1, -1, -1, -1, 0, 0, 320, 768
WinSrc  = 0, 1, -1, -1, -1, -1, 320, 0, 1278, 768
WinGVar = 0, 1, -1, -1, -1, -1, 1278, 0, 1598, 500
WinCStk = 0, 1, -1, -1, -1, -1, 1278, 500, 1598, 768
The labels representing each window should be fairly easy to interpret: WinMain = Main Debugger, WinLVar = Local Variables, WinSrc = Source, WinGVar = Global Variables, WinCStk = Call Stack. Perhaps what is less obvious are the purpose and meaning of the comma separated numbers next to each label. To summarize, these numbers represent the show state of each window as well as their location and size when the Debugger is launched. While each number has significance, the only numbers that developers need to worry about are the first two and the last four.
The first and second numbers work as a pair and seem to only have two possible values: 2,3 and 0,1. The second number itself is the most significant as it contains the value that is used in the ShowWindow API (OpenInsight developers know this better as the Visible property.) Thus, a value of 3 means the window will be maximized when it is shown and a value of 1 means the window will appear in its normal state. Referring to the above configuration values, the main Debugger window will be maximized whereas all of the MDI child windows will appear in their normal (non-maximized) positions.
The last four numbers tell the Debugger where to locate each window when it is launched. They have the following significance: Starting X position, Starting Y position, Ending X position, and Ending Y position. For WinMain, the values represent the location on the desktop itself. For the other windows the values represent the location within the MDI Client area of the Debugger. It should be noted that if the first two numbers are 2,3 (i.e., maximized), then the location numbers will be ignored. However, if a maximized window is returned to its normal state (by clicking on the Restore Down button), then it will position itself as per the values in the relevant configuration line.
Here are a few more tips that might prove helpful:
- Keep a backup copy of OINSIGHT.INI after you have the RevDebugger settings exactly the way you want. Occasionally you will accidentally re-position the Debugger or OpenInsight itself will change the values (for seemingly unknown reasons). The quickest way to recover is to close OpenInsight and copy the values from your backup copy of OINSIGHT.INI into the main OINSIGHT.INI and launch OpenInsight again.
- There is another MDI child window that can be displayed: Properties. This too can be positioned and sized. These settings will be retained for the duration of the current OpenInsight session. However, once OpenInsight has been restarted these settings are discarded. The Properties window cannot be configured to always appear even though the other MDI child windows can. Each new OpenInsight session requires that this window be invoked from the View menu or by the Ctrl+F2 accelerator.
- Be careful not to size any of the MDI child windows beyond the edges of the Debugger MDI Client. This can cause an annoying behavior when attempting to trace code. As each line of code is traced, the Debugger will minimize and then come back to view again, thus making the experience less than ideal.
If you have not customized your Debugger layout preferences before, then you are welcome to copy the above settings (optimized for a 1600×900 display) and then modify to suit your needs.
Another nice feature of the RevDebugger is the ability to bring local variables to the top of the list. This is ideal for tracking changes when stepping through the source code. It is particularly nice when the variable list is long.
To bring a variable to the top of the list depress the shift key and double click the variable that you want at the top of the list.
For OI10, it appears that these settings are now maintained in the Windows Registry at
HKEY_CURRENT_USER\SOFTWARE\RevSoft\RevDebugger
A standard layout can be saved by exporting the RevDebugger key to a .reg file. This can then be run to reset the layout when required.