Comparison with 50 Clients – UD 5.0 Benchmarks – Part 3

The previous articles in this blog series focused on the performance differences between the UD 5 and 4.7 by running tests directly on the server where the Linear Hash service was installed. This essentially limited our tests to single client loops that didn’t have the latency introduced by the network.
In this article the tests will focus on running OpenInsight across the network in parallel from 5 servers running multiple copies of the test program.
After some deliberation it was decided to run a read-only test to simulate activity on a table that was primarily used for reporting purposes. In all tests the primary measure will be the number of records read per second with better results having more records read per second.
Test Methodology
All tests were run across the network from a Linear Hash file server where OpenInsight and the Linear Hash files were located. There were a total of 5 servers each running multiple instances of the test routine. Two copies of OpenInsight 9.4 were installed on the file server and each was attached to a separate copy of the PERSON_INFO_TEST table. The first copy of OpenInsight was setup to exclusively use the Universal Driver 4.7. The second copy of OpenInsight was installed with the Universal Driver 5.0.0.2. Encryption and authentication are disabled in the UD 5.0 to keep it comparable to the UD 4.7. Delay before background indexing was turned off in both systems.
The benchmark routine is a simple loop, reading rows from the PERSON_INFO_TEST table using the ReadO statement. All 1 million of the keys in the table were predetermined and the test routine iterated over each key without doing a select of the table rows. The number of records read during each interval of the test (an interval is 5 seconds) was averaged and recorded for comparison after the test finished. No locking was performed and no indexing was added to the table. The test routine was run 3 sequential times in each system and the Linear Hash service was restarted after each run.
The first 9 intervals were discarded as a ramp-up period and only intervals 10 through 40 were graphed. To eliminate problems trying to start all clients at once and to avoid delays from launching OpenInsight, each test instance immediately went to “sleep”, waiting until all engines were fully started across all servers. Before going to sleep each engine would set a registry entry that indicated it was ready and waiting.
When all engines reported in that they were ready to begin, another registry entry was set which triggered the tests to start. All waiting test engines would then open the test data table and begin the test loop for the duration of the test. No test results were written back to the Linear Hash service to prevent non-test activity from influencing tests that were still running.
The results from each engine were aggregated together to form a throughput of all the engines during each 5 second interval. Each line in the chart below represents all of the clients from that particular test run.
5×1 LAN Benchmark – 5 Clients
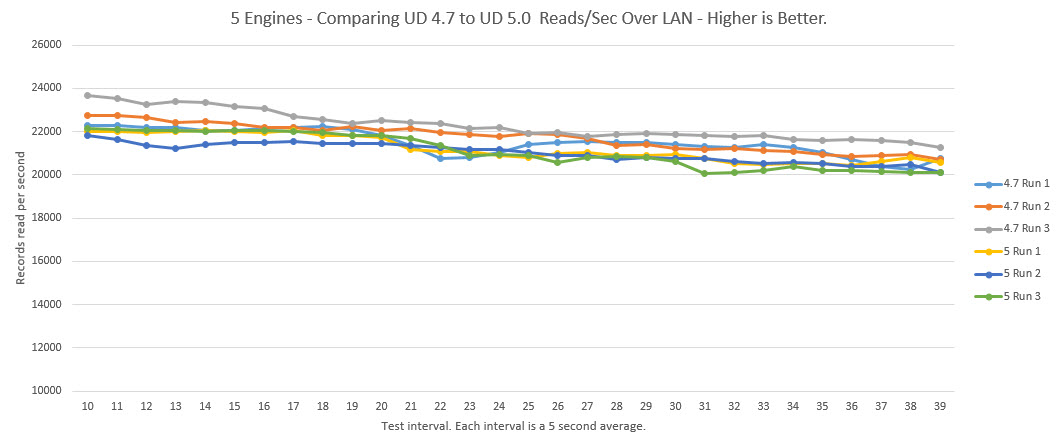
Click to enlarge
The graph shows the cumulative records read/sec by each of the clients on each of the servers was fairly consistent between each Universal Driver. The 4.7 average for the three test runs was 20,498 recs/sec and the 5.0 was 19,638.
Based on other test results and experience in the lab this fits with my anecdotal results of clients in the lab averaging 4,000 to 5,000 recs/sec across the LAN. Since there were 5 clients, one on each server, the total throughput of about 20k fits the data present. Each client had about a maximum throughput of approximately 5,000 recs/sec.
5×10 LAN Benchmark – 50 Clients
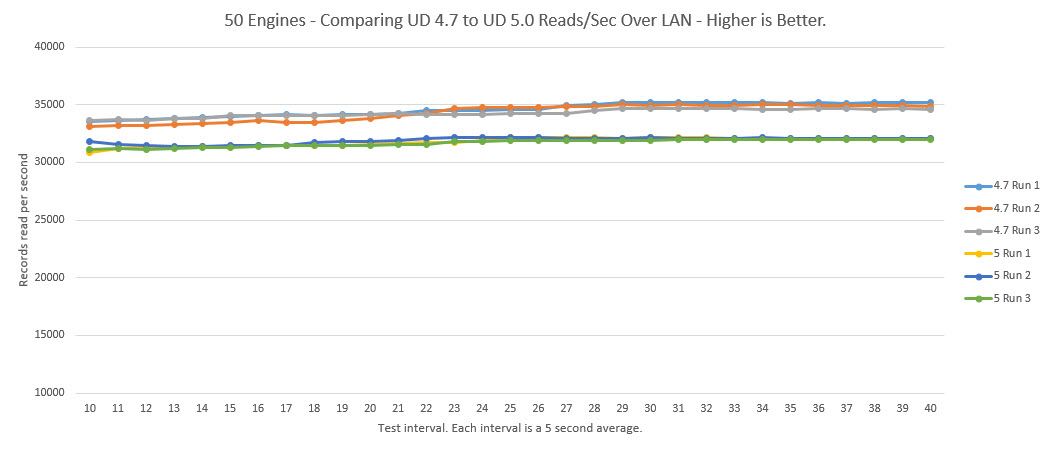
Click to enlarge
In this series of tests we see very flat and consistent performance at a rate of 32,090 to 34,847 records a second. Since each line is the average throughput of 10 clients across 5 servers we start to loose the peaks and valleys in the graph that might be present as individual instances of OpenInsight run but we can see the maximum throughput of 50 simultaneous clients in the lab environment. It’s also interesting to note that we see each of the 4.7 tests performing better than the 5.0 tests with a clear gap between the two.
Results Table
| Clients | Test Run | Recs Read | Time | Recs/Sec | 3 Run Avg. |
|---|---|---|---|---|---|
| 5 | UD 4.7 Run 1 | 4,953,855 | 251 | 19,736 | 20,498 |
| 5 | UD 4.7 Run 2 | 4,905,770 | 236 | 20,787 | 20,498 |
| 5 | UD 4.7 Run 3 | 4,949,151 | 236 | 20,971 | 20,498 |
| 5 | UD 5.0 Run 1 | 4,921,262 | 256 | 19,224 | 19,638 |
| 5 | UD 5.0 Run 2 | 4,928,596 | 251 | 19,636 | 19,638 |
| 5 | UD 5.0 Run 3 | 4,933,456 | 246 | 20,055 | 19,638 |
| 50 | UD 4.7 Run 1 | 10,196,406 | 292 | 34,919 | 34,847 |
| 50 | UD 4.7 Run 2 | 10,151,826 | 292 | 34,767 | 34,847 |
| 50 | UD 4.7 Run 3 | 10,177,997 | 292 | 34,856 | 34,847 |
| 50 | UD 5 Run 1 | 9,370,736 | 292 | 32,092 | 32,090 |
| 50 | UD 5 Run 2 | 9,393,357 | 292 | 32,169 | 32,090 |
| 50 | UD 5 Run 3 | 9,346,347 | 292 | 32,008 | 32,090 |
Conclusion
Both products appear to run consistently as the number of clients increase and at 50 clients we start to see clear line of separation between the two products. Keep in mind, these are synthetic tests in a lab environment and while the purpose of the test is to stress the maximum read rate of a heavily loaded table there are many other factors that come into a normal production environment and the results presented should be a general observation of potential differences.
The UD 5.0.0.2 has some great features that are beyond the scope of this blog series. However, these features but put it heads and shoulders above the UD 4.7. If you’re looking to decide which to use and performance is of primary concern you’ll want to develop tests that replicate your expected workload on your available computing resources.
Stay tuned for the next article in this series when we step up the number of clients to 400!
Nice work Jared and SRP!